What is Relational Nodes?
A canvas for thinking visually about how things connect
Graph-First Thinking
Start with a single node and build outward. The graph arranges itself as you add connections, and you can drag to fine-tune.
Multiple Canvases, One Tool
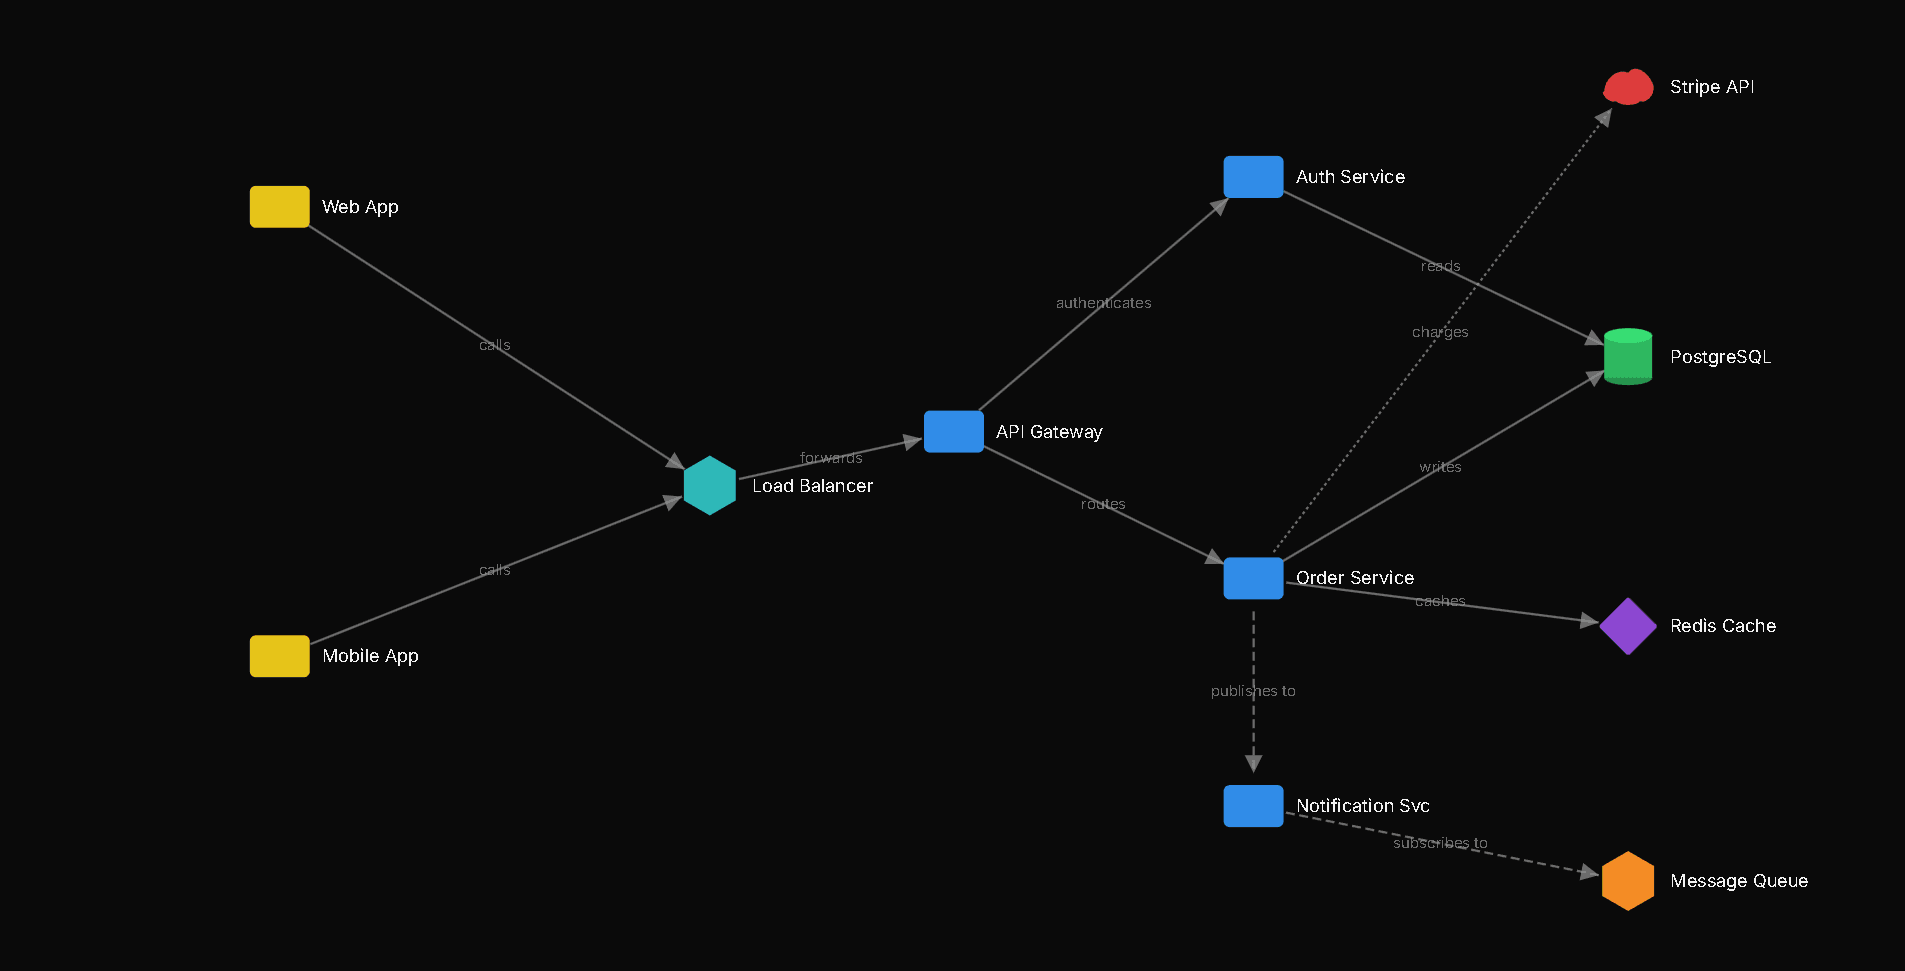
From metric decomposition to system architecture diagrams, each project category has its own rendering rules and behaviors.
Data Source Binding
Link leaf nodes directly to concrete data sources. Track mapping coverage with real-time status indicators.
Project Categories
Choose the right canvas for your problem
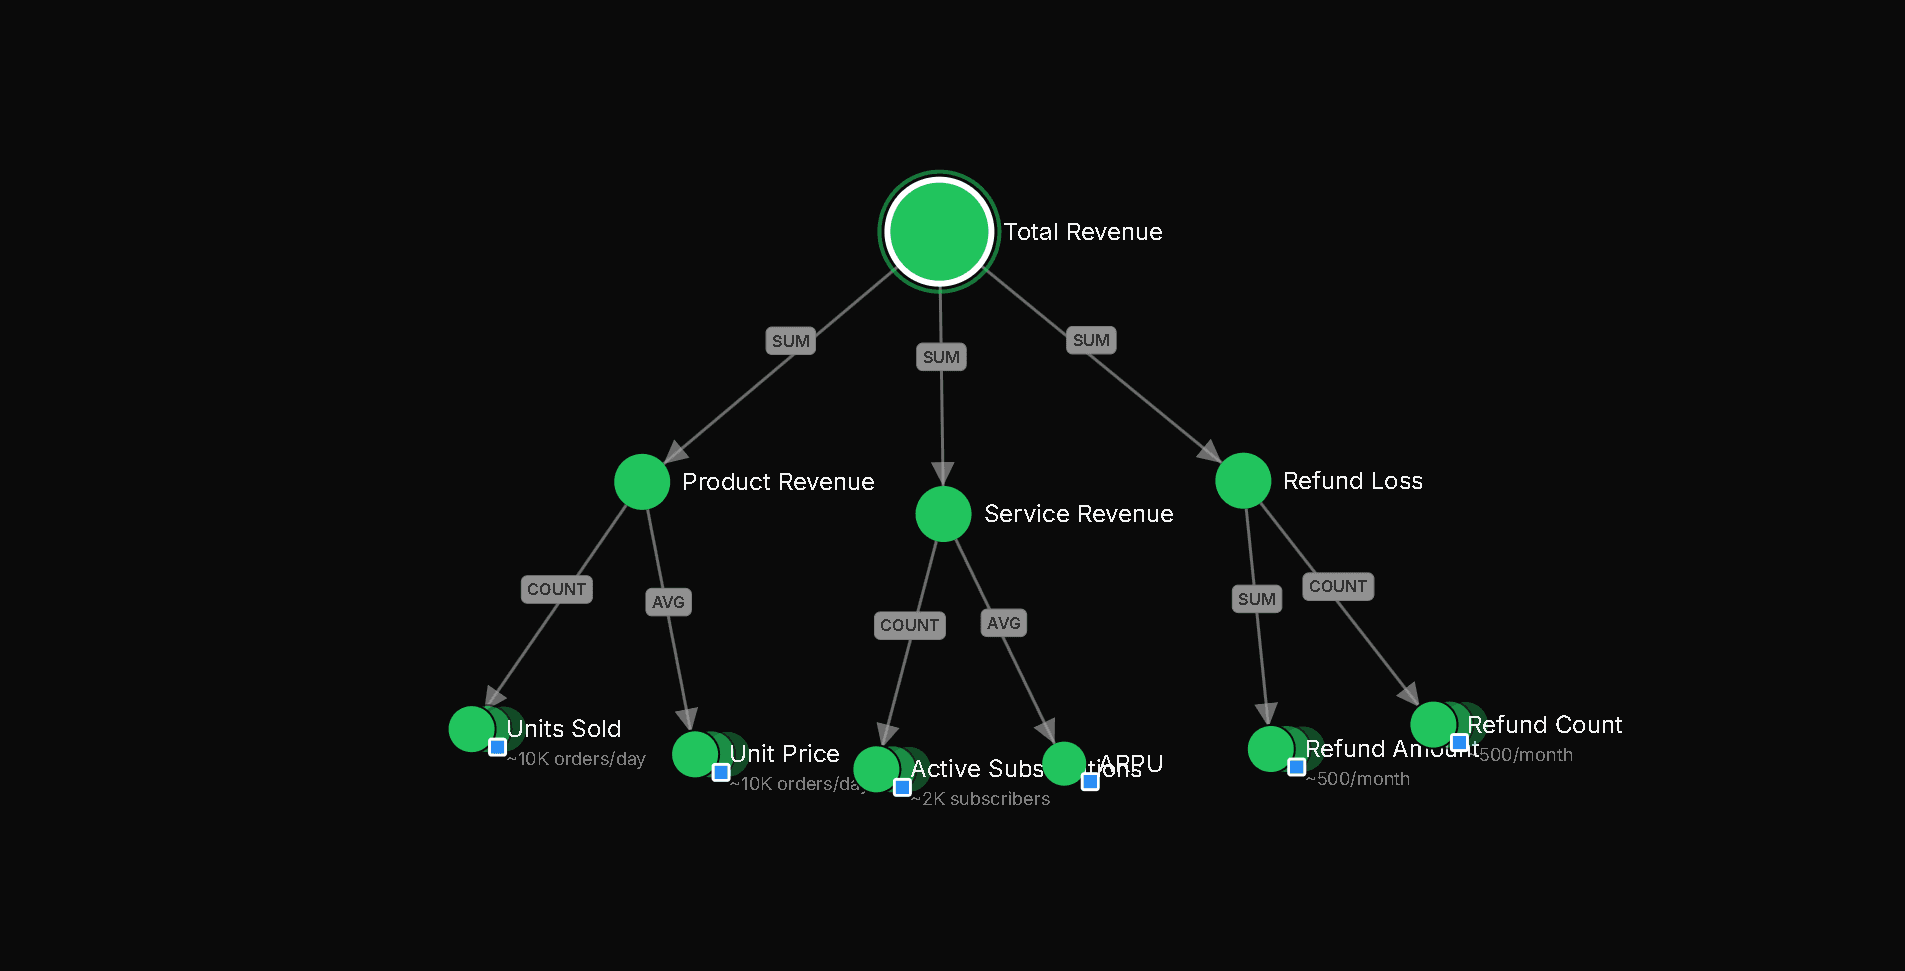
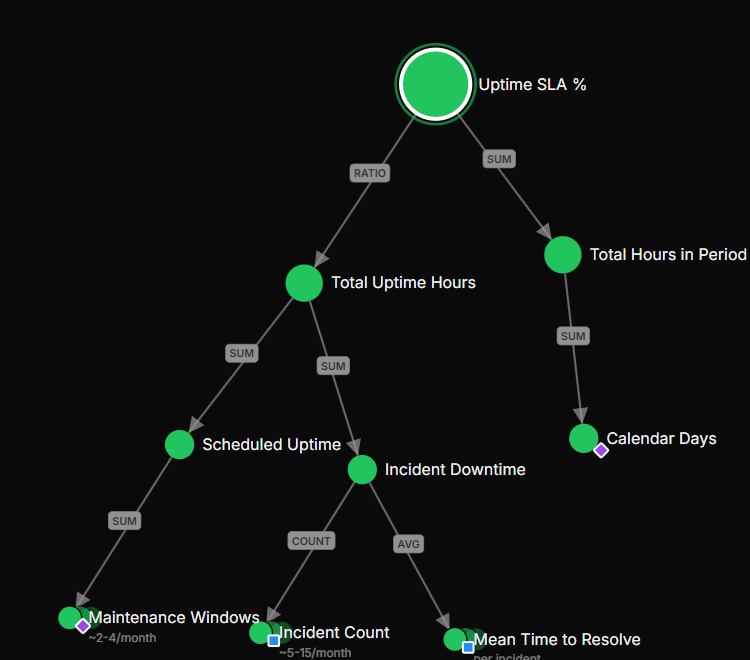
Decomposition Map
Break down metrics and KPIs into progressively smaller measurable values until reaching leaf nodes bound to concrete data sources.
- Circle nodes with depth-based sizing
- DAG-enforced structure (no cycles)
- Mapping status colors (green / orange / grey)
- Automatic smart layout
Built for teams that need clarity
Tools to map your metrics, align your team, and track what matters
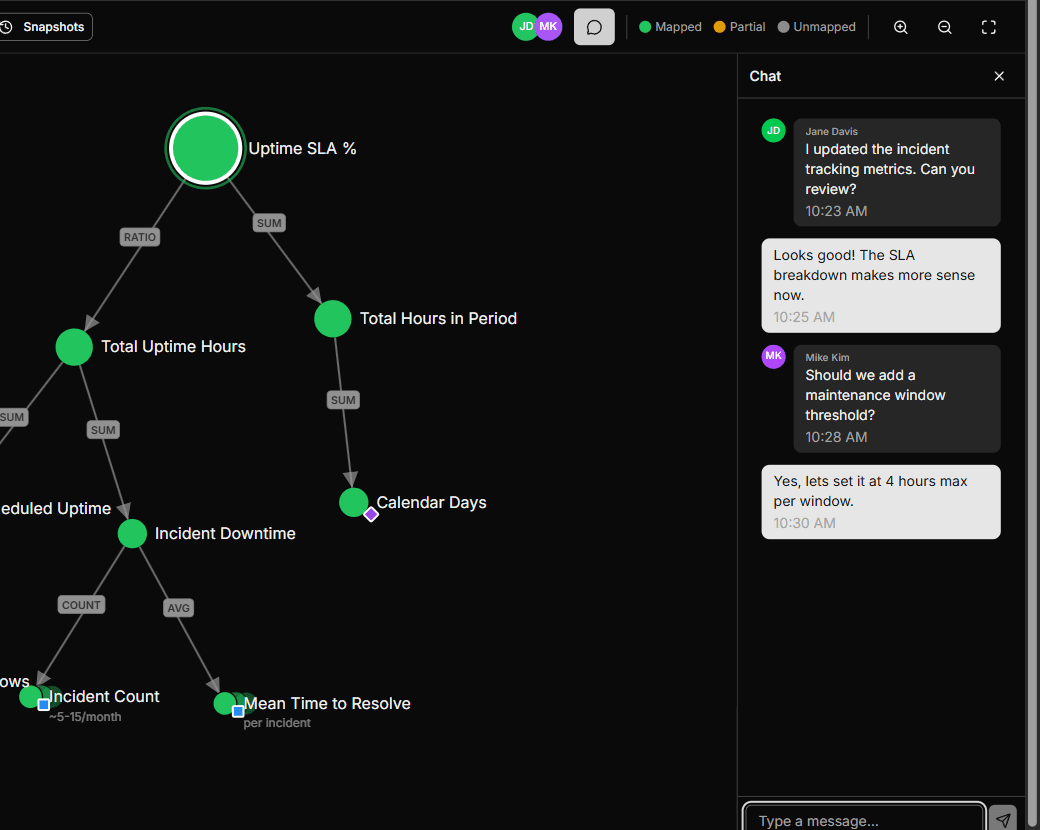
Work together in real-time
See who’s online, discuss changes with built-in chat, and watch updates appear instantly across your team.
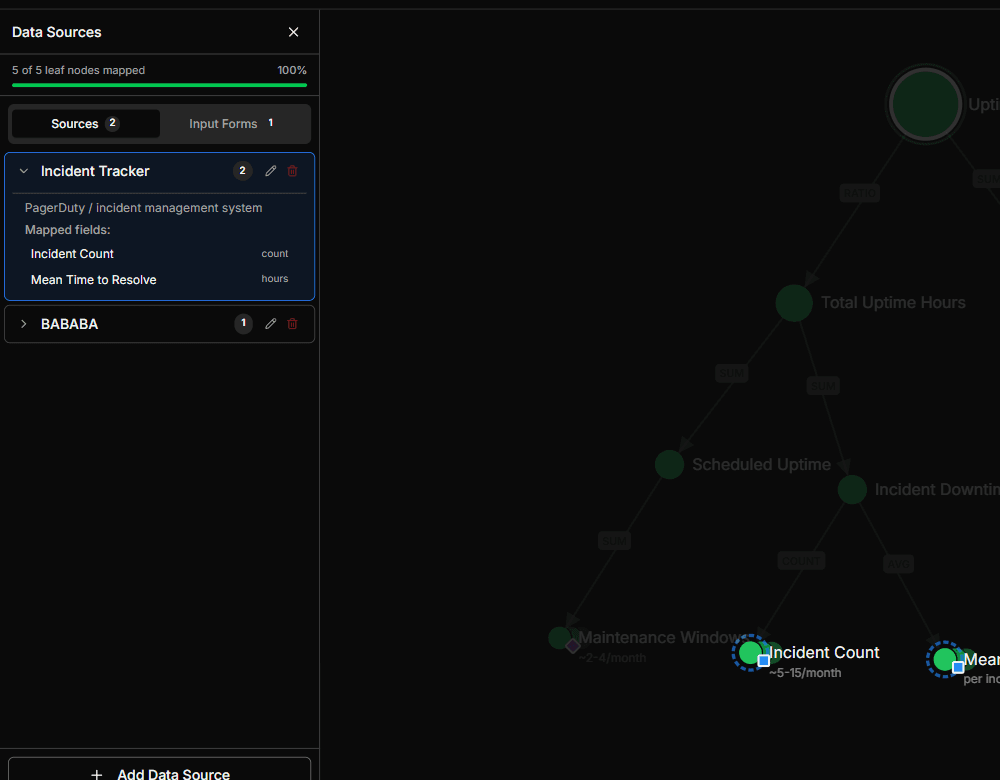
Link metrics to where they live
Connect KPIs to their underlying data sources. See at a glance which metrics are fully mapped, partially covered, or still need attention.
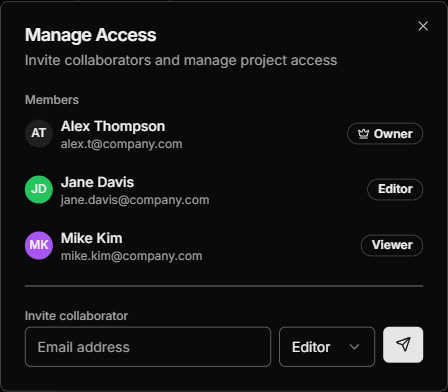
Share on your terms
Invite collaborators by email with owner, editor, or viewer roles.
Graphs that arrange themselves
Nodes position themselves as you build. Drag to adjust — everything auto-saves.
Save and restore any version
Capture named snapshots of your graph and restore them anytime.
Get started in minutes
Create a project
Pick a category, name your project, and you're on the canvas in seconds.
Build your graph
Add nodes, connect them, and drag to arrange. The layout adjusts as your graph grows.
Collaborate and iterate
Invite your team, share access, and work together in real-time. Positions sync automatically.